

The Metric Stack
Customer Satisfaction Metrics for SaaS: 8 to Track in 2026
The eight metrics SaaS teams actually use to measure customer satisfaction. With formulas, benchmarks, and which to pick at each stage.
Most teams report one metric and call it done. The teams that retain customers segment a stack of metrics by plan, role, and touchpoint.
Why one satisfaction metric is never enough
Each metric answers a different question. A team that only tracks one is looking at the customer through a keyhole.
Are customers loyal long-term?
NPS
Was this specific interaction good?
CSAT
Where is friction building?
CES
A high NPS with declining CES is a churn signal hiding in plain sight. A high CSAT with declining retention means scores skew toward your most engaged users. The stack catches what individual metrics miss.
The 8 customer satisfaction metrics
For each metric: what it measures, the formula, when to run it, and the SaaS benchmark.
CSAT
Customer Satisfaction ScoreTransactionalMeasures satisfaction with a specific interaction or experience. The most operational of the survey metrics because it moves week to week as your product and support change.
Formula
(Satisfied responses / Total responses) × 100
Satisfied = ratings of 4 or 5 on a 1-5 scale.
When to measure
After support tickets resolve, onboarding completes, feature launches, or any defined touchpoint.
SaaS benchmark
B2B SaaS support typically 85-92%. Onboarding 75-85%. Below 60% is critical.
NPS
Net Promoter ScoreRelationalMeasures overall loyalty and likelihood to recommend. The strongest long-term retention predictor when segmented by plan tier and role, not as a single overall number.
Formula
% Promoters - % Detractors
Promoters score 9-10, Detractors score 0-6, Passives (7-8) are excluded from the formula.
When to measure
Quarterly. Trigger after 30 days of active use so respondents have a meaningful opinion.
SaaS benchmark
B2B SaaS: 30-50 is good, 50+ is excellent. Early-stage: 20-45 typical.
CES
Customer Effort ScoreTransactionalMeasures how much effort the customer put in to get something done. Predicts churn at the interaction level better than CSAT - Gartner found 96% of high-effort customers become disloyal.
Formula
Average of all ratings on 1-7 scale
Higher = lower effort. Standard question: 'The company made it easy to handle my issue.'
When to measure
Immediately after support tickets, onboarding, complex purchases, or any high-effort interaction.
SaaS benchmark
B2B SaaS support 5.4-5.8. Onboarding 5.2-5.6. Above 6.0 is excellent.
PMF Score
Product Market Fit Score (Sean Ellis test)StrategicMeasures whether your product has reached market fit. The single most important metric for early-stage SaaS - until PMF is established, the other metrics are noise.
Formula
% of respondents who would be 'very disappointed' if the product disappeared
40% threshold is the Sean Ellis benchmark for product-market fit.
When to measure
Quarterly for early-stage teams. After 30+ days of active use. Less often once PMF is established.
SaaS benchmark
Below 40% = no PMF yet. 40-60% = approaching. 60%+ = strong PMF.
Retention
Customer Retention RateOutcomeThe percentage of customers retained over a period. The financial consequence of all the other satisfaction metrics combined. Falling retention is a lagging indicator that satisfaction problems exist upstream.
Formula
((End customers - New customers) / Start customers) × 100
Measure over a consistent period (monthly or quarterly).
When to measure
Reported monthly. Compared to the prior period to detect trend changes.
SaaS benchmark
B2B SaaS monthly retention 95%+. Enterprise SaaS often 99%+. SMB SaaS 90-95%.
Churn
Churn RateOutcomeThe percentage of customers lost over a period. Inverse of retention. Always segment by reason - churn-by-pricing is a different fix than churn-by-feature-gap.
Formula
(Customers lost / Total customers at start) × 100
Track both logo churn (account count) and revenue churn (MRR lost).
When to measure
Reported monthly. Investigated whenever it moves more than 0.5% in either direction.
SaaS benchmark
B2B SaaS monthly churn 1-2%. Enterprise below 1%. SMB 3-5%.
TTR
Time to ResolutionOperationalAverage time from a support ticket open to close. The strongest operational driver of CSAT and CES on support interactions. Speed matters more than perceived effort for most issues.
Formula
Sum of resolution times / Number of resolved tickets
Track first-response time separately from full-resolution time.
When to measure
Continuous. Reviewed weekly by support leadership, monthly at the org level.
SaaS benchmark
First response under 1 hour for paid plans. Full resolution under 24 hours for most issues.
Qualitative
Open-text ThemesQualitativeThe patterns in what customers actually say in open-text follow-ups. The why behind the numbers. Without qualitative themes, a CSAT score tells you something is wrong but not what to fix.
Formula
Manual or AI tagging of open-text responses into theme buckets
Pair every quantitative score with at least one open-text follow-up.
When to measure
Continuously, alongside every survey response that includes a free-text field.
SaaS benchmark
No numeric benchmark. Track theme frequency and trend over quarters.
How to pick which metrics to track
Adding more metrics before you can act on them produces dashboards, not decisions. Pick the smallest set that drives action at your stage.
Early-stage
Pre-PMF, under 500 users
Find PMF, fix onboarding
At this stage you do not need a metric stack. You need to know if the product fits the market and where the activation flow is breaking. Two metrics is the right number.
Mid-market
Post-PMF, 500-10k users
Operational excellence + segmentation
PMF is established. Now you need to find the segments that are underperforming and the touchpoints creating friction. Four metrics with proper segmentation is enough.
Enterprise
10k+ users / $10M+ ARR
Maintain across segments, catch segment-specific issues
At this scale the question is no longer 'how are we doing' but 'where are we slipping'. Every metric needs to be cut by multiple dimensions. Time to resolution and qualitative themes become essential operational metrics.
Every metric needs to be segmented
An overall score is a thermometer. A segmented score is a diagnosis.
Without segmentation
“Looks healthy. No action needed.”
- Cannot tell which segment is at risk
- Cannot prioritise what to fix first
- Top accounts can churn quietly
With segmentation
Action: Enterprise CSMs reach out this week.
The same logic applies to CSAT, CES, churn, and every other metric on this page. See the 6 SaaS segmentation models for the operational playbook.
One survey can collect four of these metrics
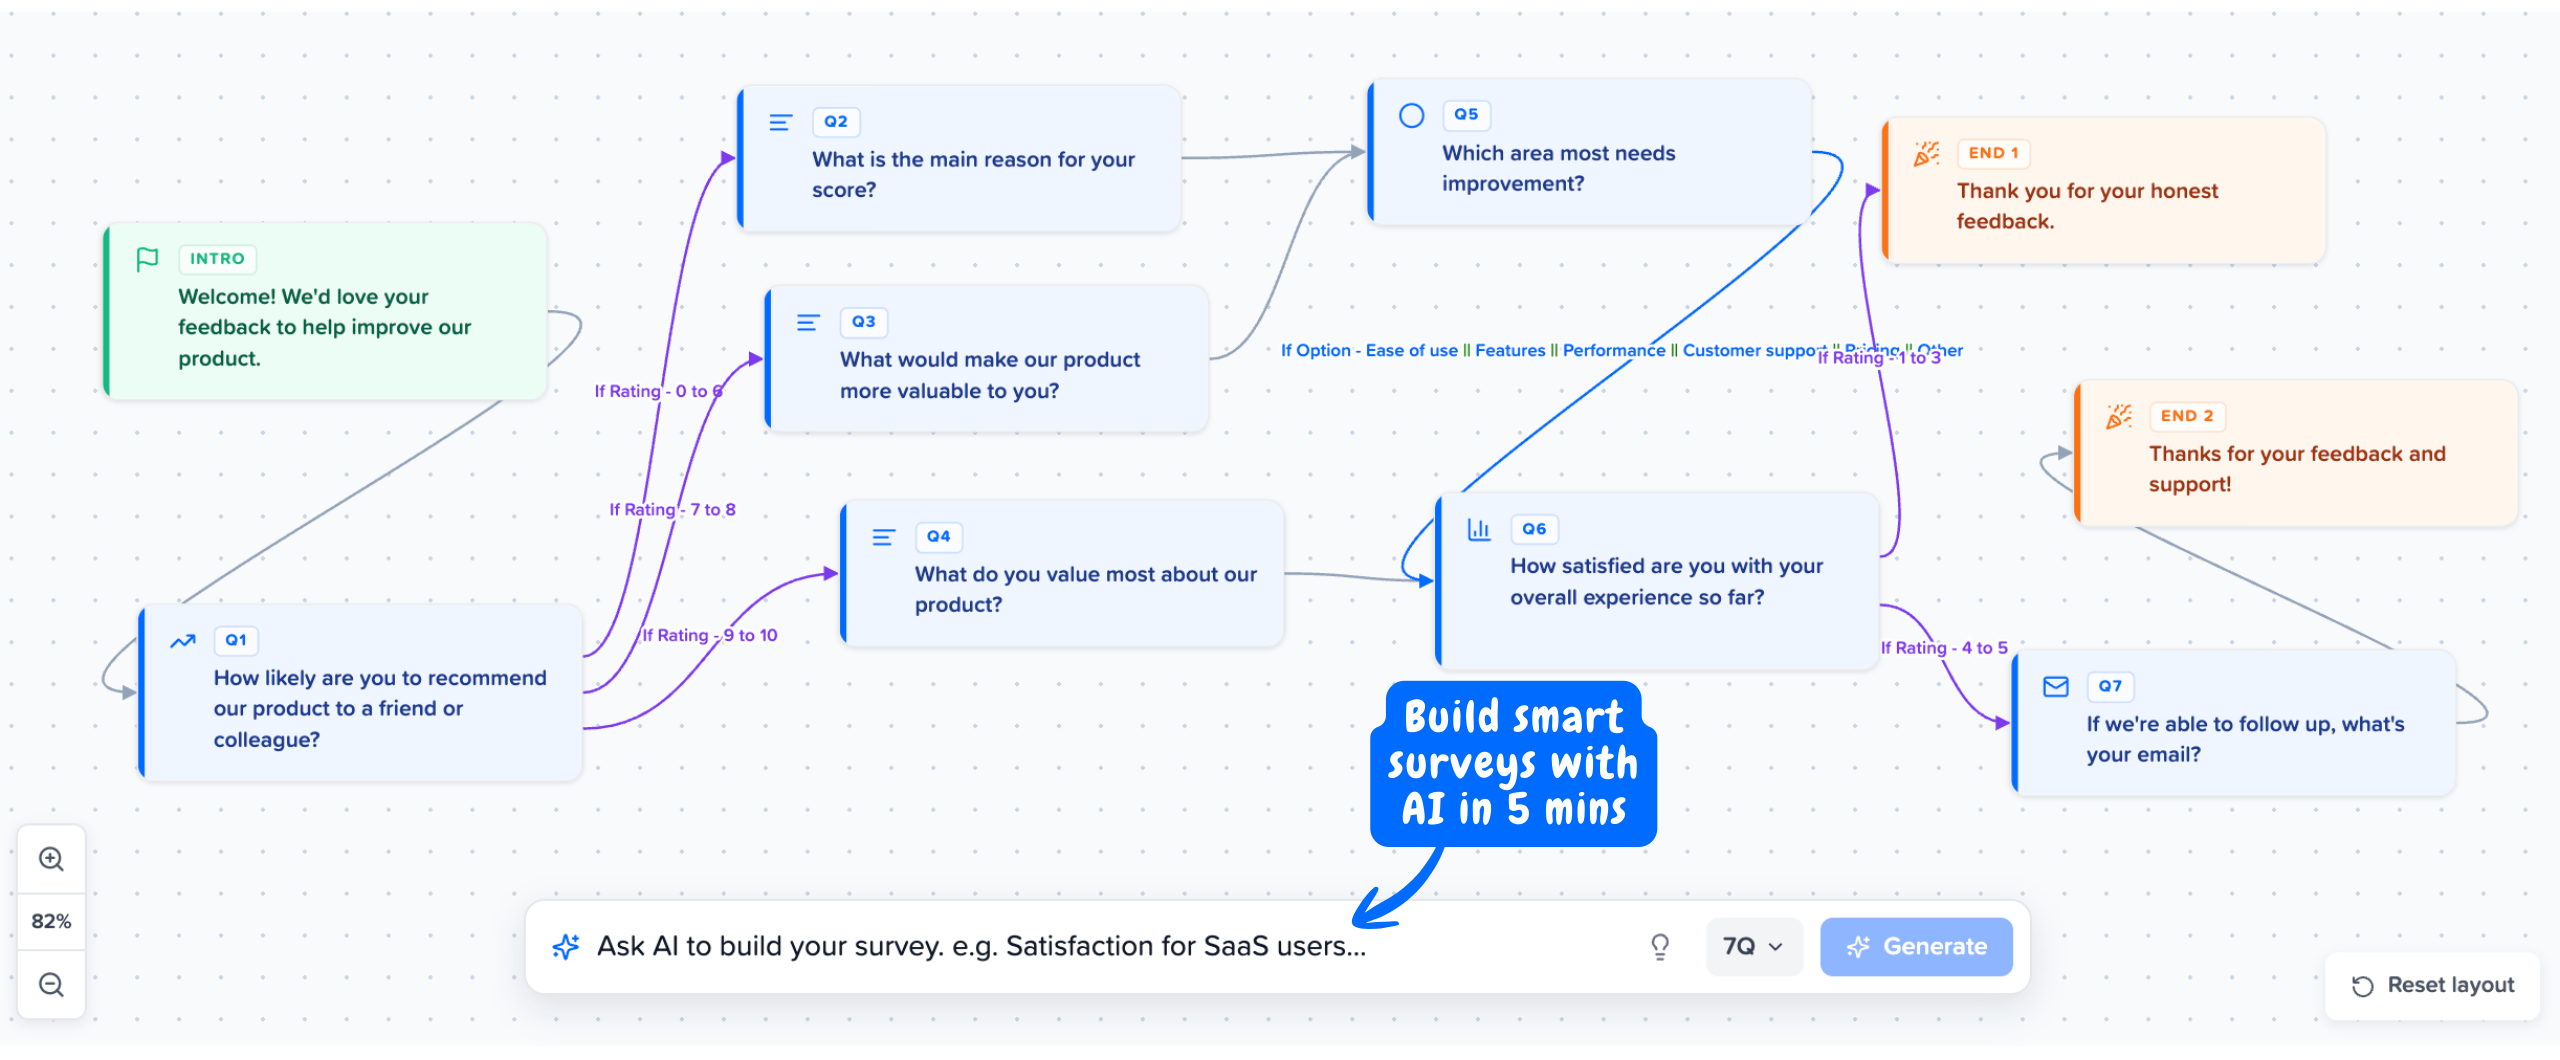
Mapster builds NPS, CSAT, CES, and PMF surveys with branching logic in 2 minutes. Promoters take a different path than detractors. Free users get different follow-ups than Pro users. Every response auto-segmented by the attributes you pass.
No credit card required
Common customer satisfaction metric mistakes
Six missteps that quietly invalidate the entire metric program.
Reporting overall averages without segmentation
A blended overall score reassures the executive team while specific segments churn. Always segment by plan tier, role, region, and signup cohort before declaring a number good or bad.
Tracking too many metrics too early
Eight metrics before product-market fit is dashboard theatre. Pre-PMF teams should track 2 metrics. Mid-market 4. Enterprise 8. Adding metrics before you can act on them slows decisions, not speeds them.
Skipping the open-text follow-up
A score tells you something is wrong. The open-text tells you what. Quantitative metrics without paired qualitative themes give you dashboards that look authoritative but cannot drive specific fixes.
Confusing transactional and relational metrics
CSAT and CES are transactional - run them per interaction. NPS is relational - run it quarterly. Mixing the cadences (quarterly CSAT, post-ticket NPS) destroys the meaning of each.
Calculating CSAT without removing neutrals
Only ratings of 4 and 5 count as satisfied on a 1-5 scale. Neutral (3) and dissatisfied (1-2) are excluded from the numerator. Calculating CSAT as a simple average of all responses is mathematically wrong and inflates the score.
Survey fatigue from no suppression rules
Customers who get 4 surveys in 2 weeks stop responding. Set per-user suppression at 30-90 days depending on the metric. Sample subsets rather than surveying the entire base every time.
Run NPS, CSAT, CES, and PMF in one tool with segmentation built in
Native templates for every satisfaction metric. Every response linked to a real user. Segment by plan, role, or any custom attribute. Free plan available, Pro from $8/mo.
Start Tracking SaaS Metrics FreeNo credit card required