CES Surveys for SaaS
CES Survey Tool - Free Customer Effort Score Surveys
Track CES by User Segment, not just overall
Send CES surveys after every support ticket, onboarding session, or feature interaction. Link each effort score to a real user. Segment by interaction type, plan tier, or support agent - and know exactly where customers are working too hard.
No credit card required
What is a CES Survey?
A Customer Effort Score survey measures how much effort a customer had to put in to get something done. Lower effort predicts higher retention - and higher effort predicts churn.
The Standard CES Question
“The company made it easy to handle my issue.”
CES 2.0 - 1 to 7 agreement scale
A follow-up open-text question - “What made this difficult?” - turns the rating into a specific action item. Keep it optional to protect response rates.
How CES is Calculated
Formula
CES is a simple average. Higher scores mean lower effort. Track separately per interaction type - don't blend support and onboarding into one number.
Example: 10 support tickets averaged 5.8/7 → CES 5.8 (good)
What is a Good CES Score?
CES benchmarks by score range - and what each tells you about friction in your product and support.
Customers are working hard to get help. 96% of high-effort customers become disloyal. Fix these interactions immediately.
Some friction. Segment by interaction type to isolate which touchpoints are dragging the score down.
Solid. Most interactions feel reasonably easy. Monitor for specific cases with effort ratings below 4.
Low-effort experience. Customers resolve issues without significant friction. Protect this by tracking per interaction type.
Support CES benchmarks higher than onboarding CES. B2B SaaS support benchmarks at 5.4–5.8, onboarding at 5.2–5.6, and self-service at 5.6–6.0. Compare like-for-like - don't blend interaction types into a single metric. See full CES benchmarks →
Track CES by User Segment, not just overall
Run Surveys inside your product. Every response linked to a user and location. Spot the patterns that matter.

Why Segmented CES
Beats Average CES Every Time
An overall CES hides where the friction actually lives. Segmented CES tells you exactly which interaction type is costing you customers.
Without Segmentation
"Borderline okay. Not sure what to fix."
• You don't know which interactions create friction
• You don't know which users are struggling
• You can't prioritize what to fix first
• Churn accumulates and you're caught off guard
With Segmentation
Onboarding
Setup is smooth - no action needed
Feature: Billing
High friction - docs are missing
Support tickets
Slow resolution on billing issues
→ Clear action: fix billing docs and support SLA immediately
When to Send CES Surveys
CES is transactional - send it immediately after a specific interaction while the friction is still fresh.
Support CES
After support ticket resolution
The most common CES trigger. Sent the moment a ticket is marked resolved. Scores below 5.0 signal a specific agent, issue category, or process that needs fixing - not just the outcome, but the journey to get there.
Set up a post-support surveyOnboarding CES
After onboarding completion
Measures how much effort the setup process required. High onboarding effort is one of the strongest early predictors of churn. A low score here means customers are struggling before they ever see value.
Set up an onboarding surveyFeature CES
After a feature is first used
Captures effort for a specific feature right after first use. Segment by user type to find which cohorts find a feature straightforward vs confusing - and where your docs or UX needs work.
Set up a feature feedback surveyPurchase CES
After a checkout or upgrade flow
Buying friction kills conversions and seeds regret. CES after upgrade flows reveals where your pricing page, payment form, or contract process creates unnecessary effort - before it shows up in expansion revenue.
CES vs CSAT vs NPS
Which to Use When
They answer different questions. The strongest teams use all three - at different times.
CES
Measures effort at a moment
→ When: After a specific interaction
→ Question: “How easy was it to...?”
→ Scale: 1–7
→ Best for: Support, onboarding, features
→ Predicts: Churn at interaction level
CSAT
Measures satisfaction with an outcome
→ When: After a specific interaction
→ Question: “How satisfied were you with...?”
→ Scale: 1–5
→ Best for: Support quality, product updates
→ Predicts: Satisfaction per touchpoint
NPS
Measures overall loyalty
→ When: Quarterly or at milestones
→ Question: “How likely to recommend us?”
→ Scale: 0–10
→ Best for: Overall health, renewal risk
→ Predicts: Long-term loyalty and growth
Rule of thumb: Use CES after every high-effort touchpoint. Use CSAT after interactions where quality matters more than effort. Use NPS quarterly for overall health. A high NPS with low CES support scores is a ticking clock - fix effort before it accumulates into churn.
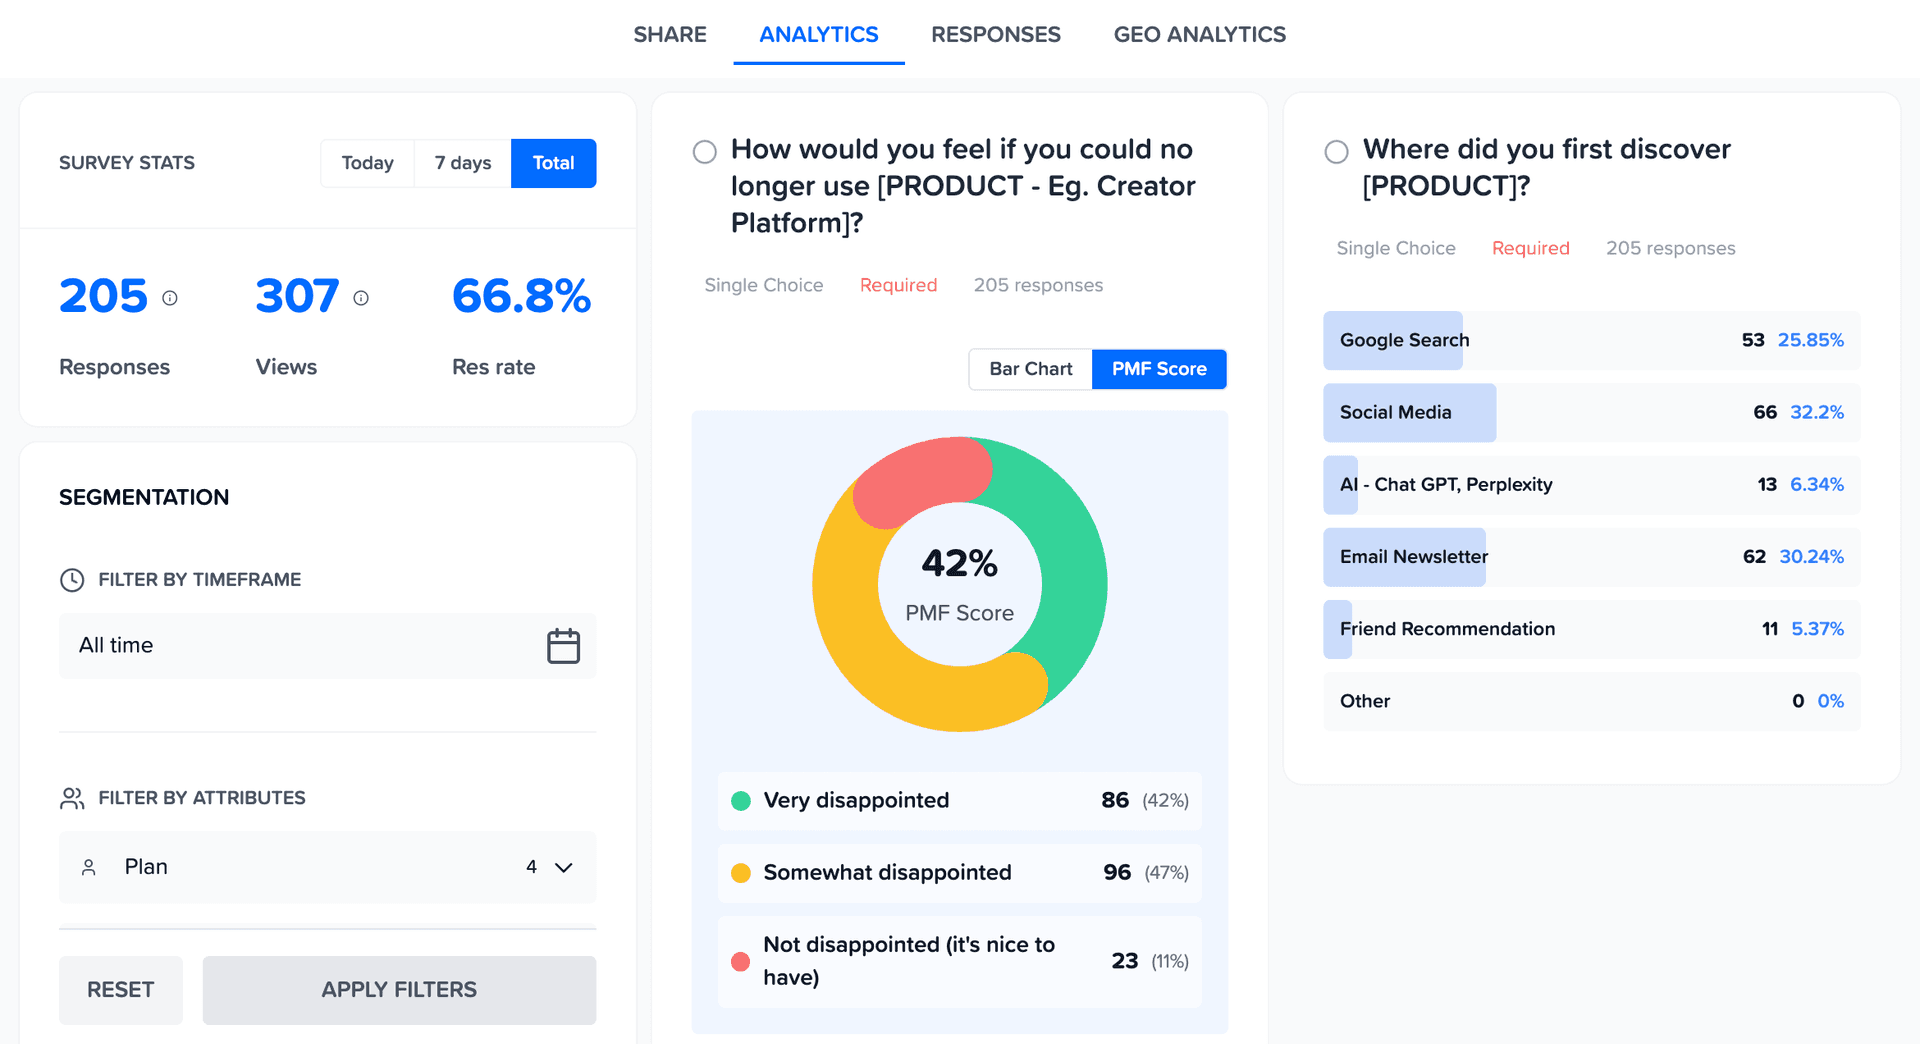
Powerful Analytics
Analytics that connect the dots for you
See trends, patterns, and priorities without digging through spreadsheets.
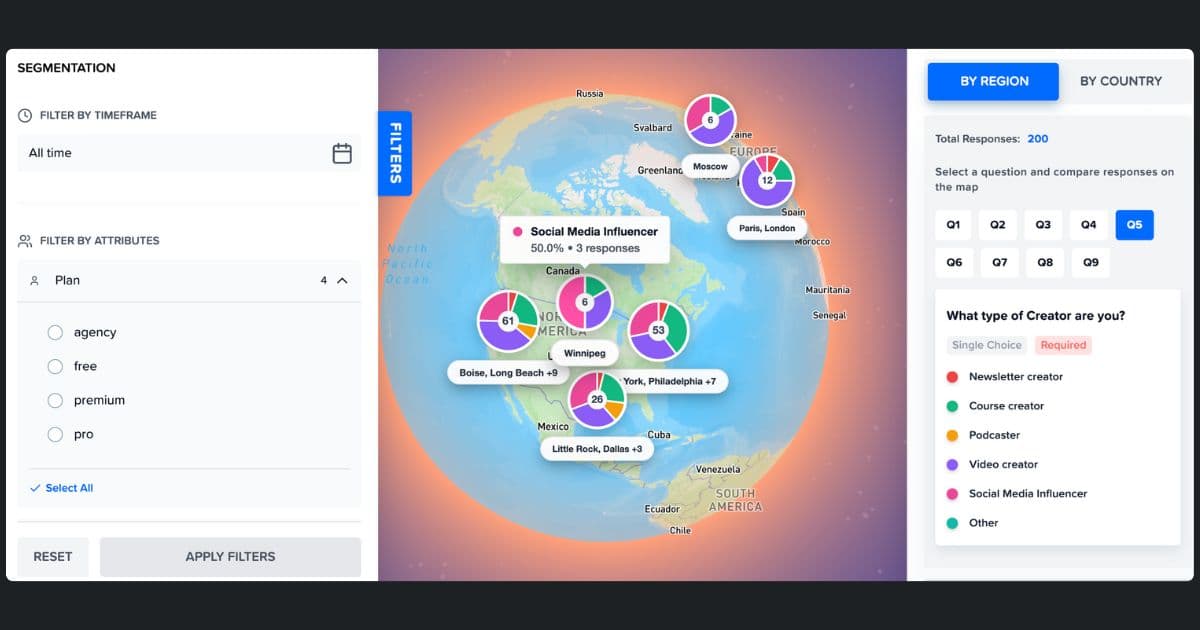
Geo Analytics
See Feedback on World Map
Your US customers love you. Your EU customers are frustrated. You'd never know from an average. Map feedback by region to spot geographic patterns instantly.
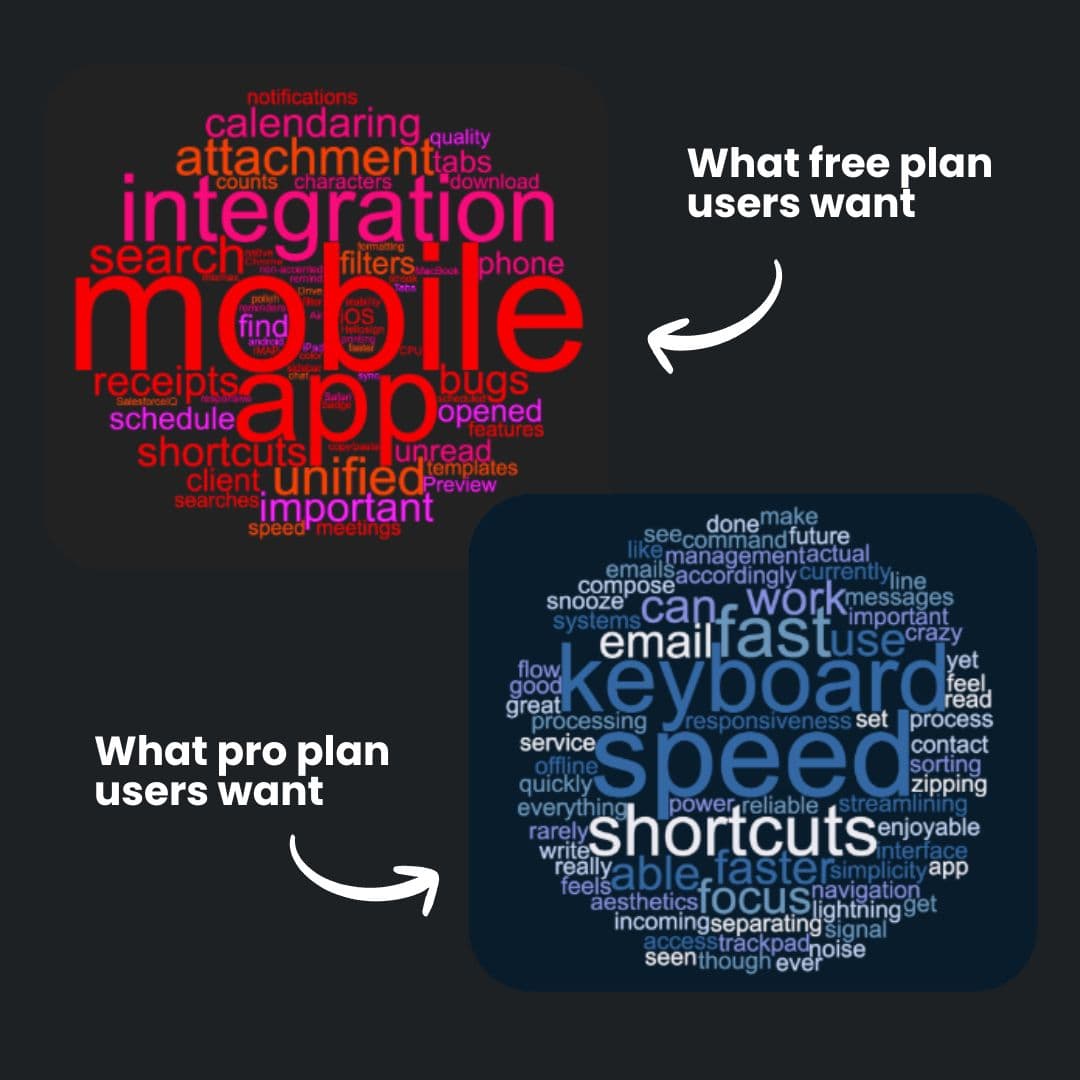
Analyze like a Pro
See Word Cloud from Open-Ended Feedback
See what each segment is actually saying. One word cloud per segment - so you know what matters to who.
- ✓Auto-generated from survey responses
- ✓Filter by segment to see different priorities
- ✓Spot patterns without reading every response
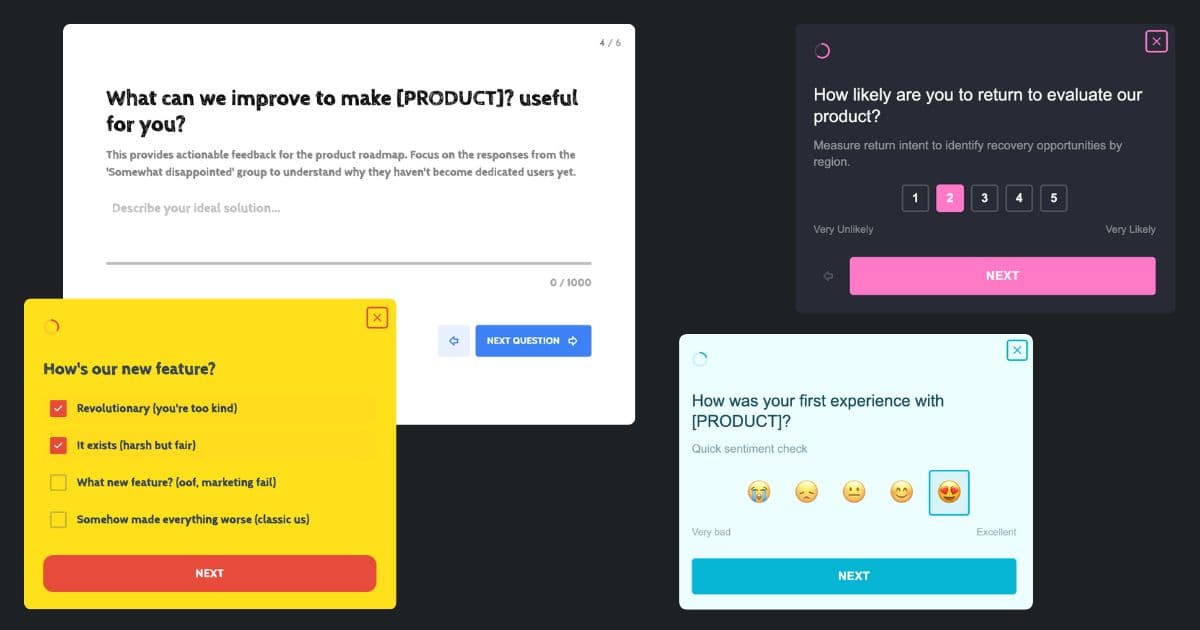
Build like a Pro
Surveys that look like your product
Match your surveys to your product. Custom colors, logo, and styling — so feedback collection feels native, not third-party.
Frequently Asked Questions
What is a CES survey tool?
A CES survey tool lets you send Customer Effort Score surveys after specific interactions - support tickets, onboarding, or feature use - collect 1-7 effort ratings, and calculate your CES automatically. Mapster links every response to the user who submitted it so you can segment CES by interaction type, plan, support agent, or any custom attribute.
What is the standard CES survey question?
The CES 2.0 standard uses a statement: "The company made it easy to handle my issue." Customers rate agreement on a 1-7 scale (1 = Strongly Disagree, 7 = Strongly Agree). Some teams use a direct question: "How easy was it to [complete task]?" on a 1-5 scale. Both work - the 1-7 agreement scale is the original standard.
What is a good CES score?
On a 1-7 scale, a CES above 5.5 is generally considered good and 6.0+ is excellent. B2B SaaS support benchmarks at 5.4–5.8, onboarding at 5.2–5.6. Always compare like-for-like - track support and onboarding separately, not as a blended average.
When should I send a CES survey?
CES works best as a triggered survey sent immediately after a specific interaction: support ticket resolution, onboarding completion, first feature use, or after a checkout or upgrade flow. Triggered CES surveys capture friction while the memory is fresh and get significantly higher response rates than periodic batch surveys.
Why should I segment my CES results?
Averages hide problems. An overall CES of 5.1 can hide a billing feature scoring 3.8 - the exact touchpoint driving your churned accounts. Mapster links every response to the user who submitted it so you can filter CES by interaction type, plan, support agent, or any attribute you track.
How many questions should a CES survey have?
One core effort rating question plus one optional open-text follow-up. The follow-up asks what made it difficult (for scores below 5) or what made it easy (for scores above 6). Keep it short - CES is sent immediately after an interaction and longer surveys see significantly lower completion rates.
Start measuring customer effort today
Run your first CES survey in minutes. Link every effort score to a real user. Segment by interaction type, plan, or support agent. Free to start.
Launch Your Free CES SurveyNo credit card required