Free feedback survey tool
Customer Feedback Surveys with Context
Every response linked to a user and location. Spot the patterns that matter.
Know Who (user) Said What (feedback) and Where (location)
No credit card required

Feedback with context
Other tools
"100 users are happy, 40 are unhappy."
Mapster Surveys
100 happy users · pro plan users · from USA · "love onboarding"
40 unhappy users · free plan users · from EU · "frustrated by pricing"
See which users gave what feedback, from where

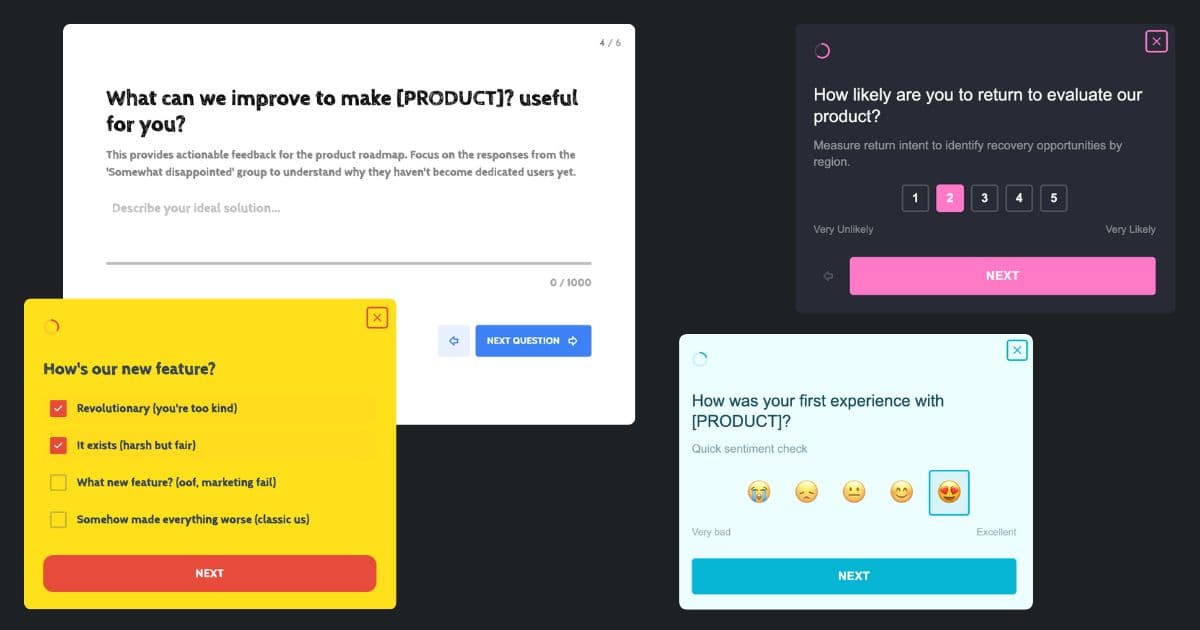
Build Surveys that look like your brand

Know which user gave
what feedback
Trusted by over 100+ Startups worldwide
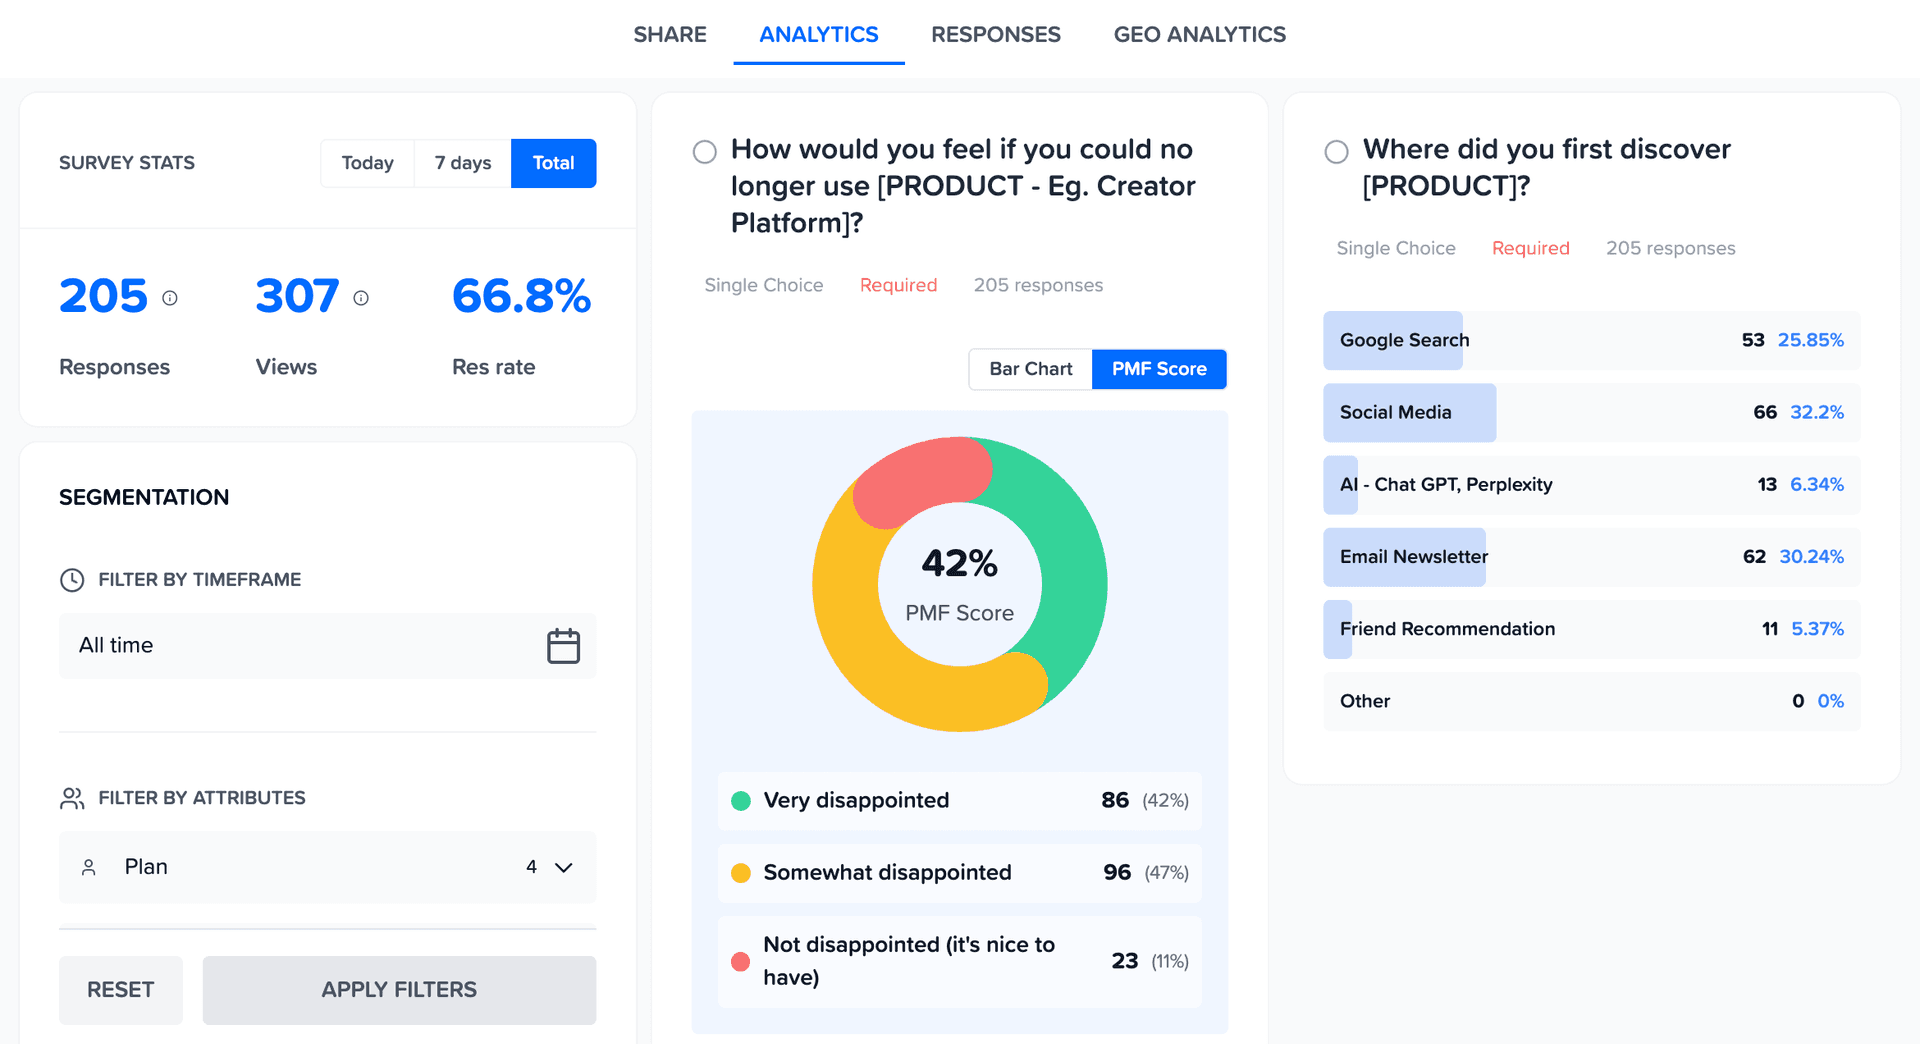
Powerful Analytics
Analytics that connect the dots for you
See trends, patterns, and priorities without digging through spreadsheets.
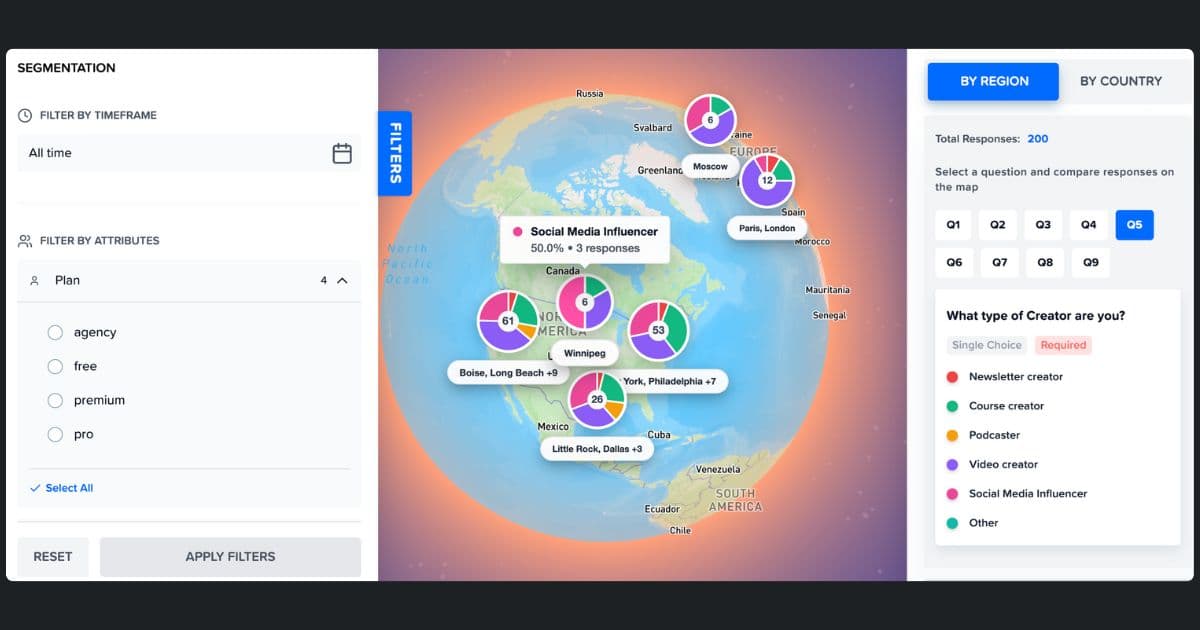
Geo Analytics
See Feedback on World Map
Your US customers love you. Your EU customers are frustrated. You'd never know from an average. Map feedback by region to spot geographic patterns instantly.
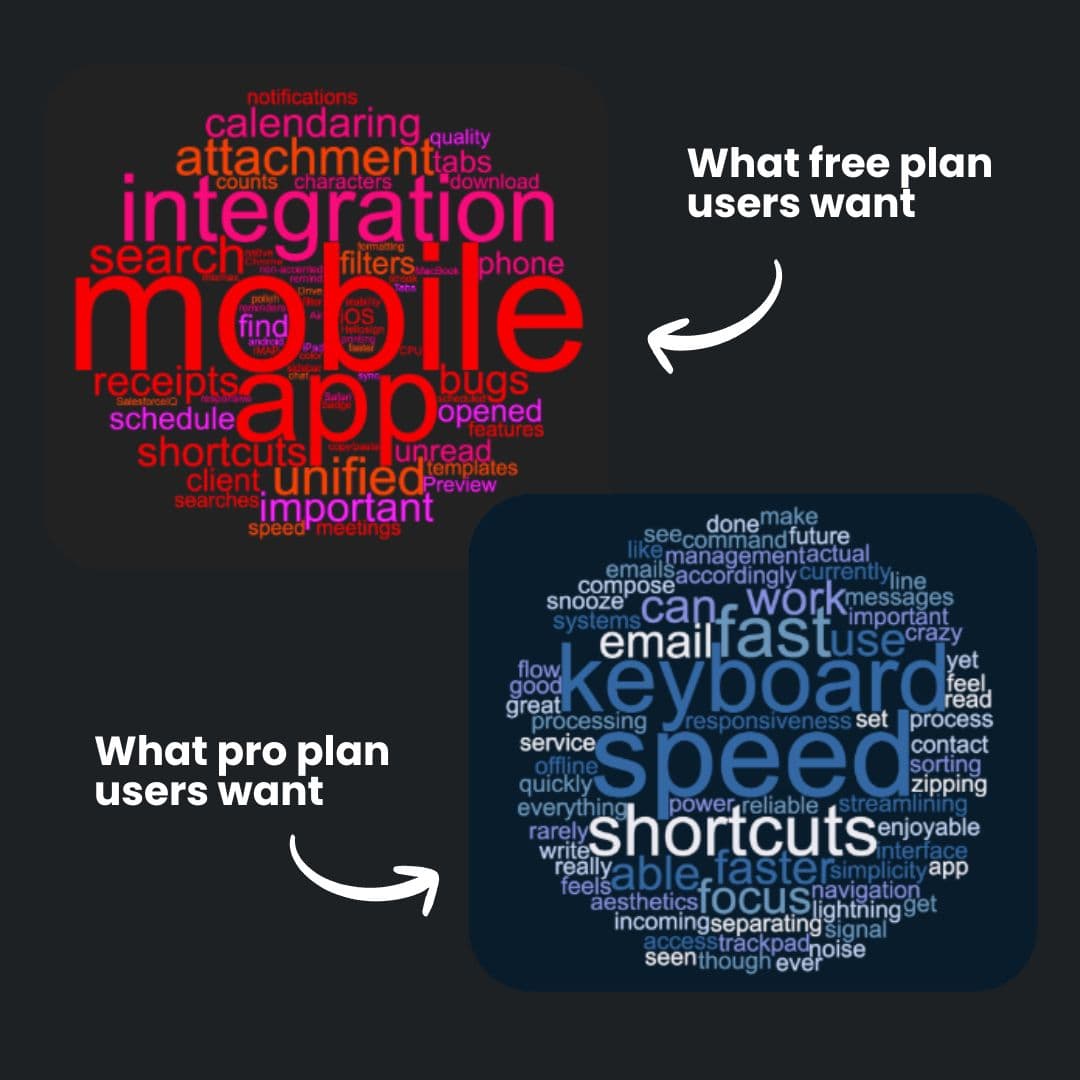
Analyze like a Pro
See Word Cloud from Open-Ended Feedback
See what each segment is actually saying. One word cloud per segment - so you know what matters to who.
- ✓Auto-generated from survey responses
- ✓Filter by segment to see different priorities
- ✓Spot patterns without reading every response
Build like a Pro
Surveys that look like your product
Match your surveys to your product. Custom colors, logo, and styling — so feedback collection feels native, not third-party.